
With over 60% of the world's 16,000-plus disc golf courses, the United States has by far more places to play disc golf than any other country. Unsurprisingly, more total rounds of disc golf are played there per year than anywhere else.
But where in the U.S. is disc golf most popular? Here's where you can find out.
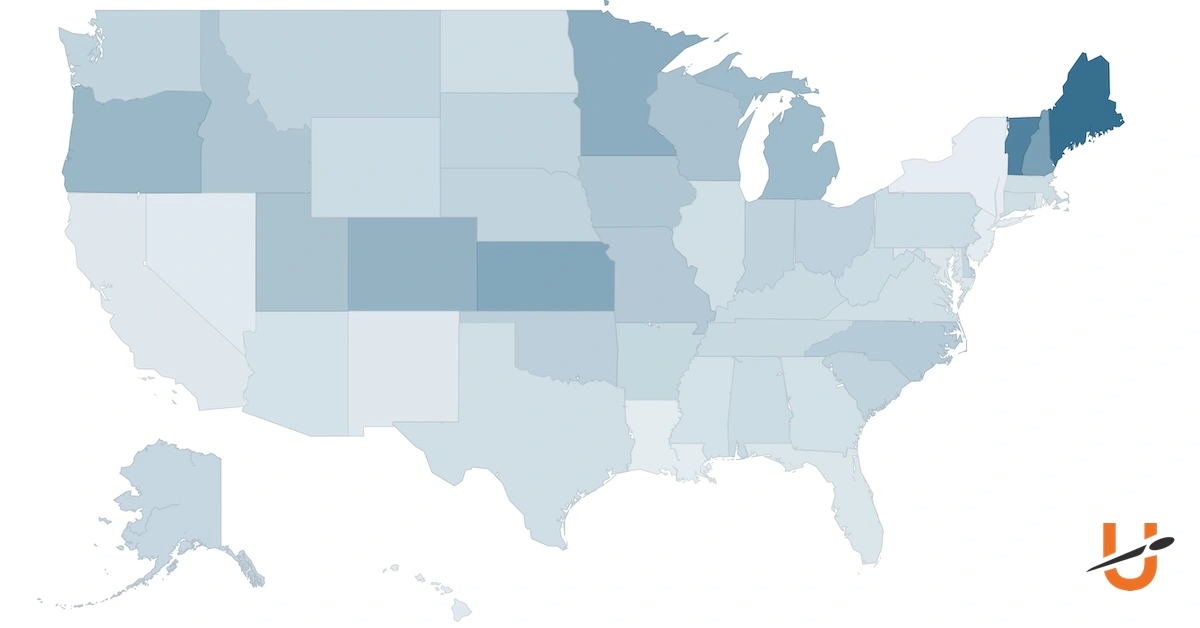
Discover below which U.S. states (plus D.C.) logged the most rounds of disc golf per capita and in general with the UDisc app, the sport's most popular method for scorekeeping, course-finding, and much more.
What Stuck Out
At UDisc, we love stats and the stories they tell (just take a look at our latest Disc Golf Growth Report if you don't believe us). Here's what stuck out to us from the numbers you'll find in the rankings later on:
- A Maine-stay at #1
The last time we published these rankings was back in 2022 using round counts from 2021. While every state that made the top five in rounds per capita then is also top five here, only one of them has the exact same rank – Maine, which is still in the #1 spot. Despite harsh winters and the fact that the vast majority of courses in the state are pay-to-play, Mainers appear to consistently enjoy more rounds of disc golf per person than any other state's population. - Jumping for joy of disc golf
The state that had the biggest growth in rounds when comparing 2021 to 2024 stats is Michigan, with over 187,000 more rounds recorded. Nebraska made the largest leap in the rounds-per-capita rankings, jumping 10 spots from 29th to 19th. - General growth
The average 2021 to 2024 difference in rounds recorded in states was an increase of 32,823 rounds, and 46 of the 50 states saw positive change. - Everything's bigger...
Texas – the second-largest U.S. state by population after California – was the only state to have over 1 million rounds recorded with UDisc in 2024.
About the Stats
Here are things you should know about the stats used to make the rankings of which U.S. states play the most disc golf:
- Round counts – Why UDisc rounds are a good measuring stick
The round totals refer to rounds recorded with the UDisc app from January 1-December 31, 2024. Since UDisc is the sport's most popular form of mobile scorekeeping, it's extremely likely that where there are the most UDisc rounds, there are also the most rounds in general. - Round counts – The actual numbers are much higher
Though UDisc round counts are the best measurement in the sport for showing disc golf's popularity, far from every round is recorded with UDisc. Bear in mind that as impressive as the round counts are, the real numbers are likely thousands, tens of thousands, or, in some cases, hundreds of thousands more. - Population
Population totals come from estimates for 2024 from the U.S. Census Bureau. - Not exactly "per capita"
Stat aficianados will notice that the "Rounds Per 100 Residents" figure we use under the "Per Capita" header isn't exactly "per capita" (though, importantly, the rankings would stay the same even if we had used a strict interpretation). This is a conscious choice we made to help readers better understand the numbers as well as find them if they look for them.
Which U.S. States Play the Most Disc Golf Per Capita?
| Rank | State | Disc Golf Rounds Per 100 Residents 2024 with UDisc | Disc Golf Rounds 2024 with UDisc | Population |
| 1 | Maine | 12.83 | 180,307 | 1,405,012 |
| 2 | Vermont | 11.47 | 74,391 | 648,493 |
| 3 | New Hampshire | 9.39 | 132,279 | 1,409,032 |
| 4 | Kansas | 8.91 | 264,552 | 2,970,606 |
| 5 | Minnesota | 8.50 | 492,208 | 5,793,151 |
| 6 | Colorado | 8.06 | 480,045 | 5,957,493 |
| 7 | Oregon | 7.77 | 331,949 | 4,272,371 |
| 8 | Michigan | 7.43 | 753,150 | 10,140,459 |
| 9 | Utah | 6.98 | 244,596 | 3,503,613 |
| 10 | Wisconsin | 6.93 | 413,355 | 5,960,975 |
| 11 | Idaho | 6.68 | 133,633 | 2,001,619 |
| 12 | Iowa | 6.64 | 215,101 | 3,241,488 |
| 13 | Missouri | 6.30 | 393,534 | 6,245,466 |
| 14 | North Carolina | 6.03 | 665,896 | 11,046,024 |
| 15 | Oklahoma | 5.55 | 227,300 | 4,095,393 |
| 16 | Ohio | 5.20 | 617,917 | 11,883,304 |
| 17 | Indiana | 5.09 | 352,225 | 6,924,275 |
| 18 | South Carolina | 5.03 | 275,587 | 5,478,831 |
| 19 | Nebraska | 5.01 | 100,390 | 2,005,465 |
| 20 | South Dakota | 5.00 | 46,190 | 924,669 |
| 21 | Montana | 4.97 | 56,531 | 1,137,233 |
| 22 | Washington | 4.92 | 391,914 | 7,958,180 |
| 23 | Delaware | 4.66 | 49,042 | 1,051,917 |
| 24 | Arkansas | 4.63 | 143,049 | 3,088,354 |
| 25 | Alaska | 4.52 | 33,459 | 740,133 |
| 26 | Tennessee | 4.25 | 306,954 | 7,227,750 |
| 27 | Kentucky | 4.15 | 190,443 | 4,588,372 |
| 28 | Alabama | 4.10 | 211,656 | 5,157,699 |
| 29 | Pennsylvania | 4.09 | 534,450 | 13,078,751 |
| 30 | Wyoming | 3.97 | 23,356 | 587,618 |
| 31 | West Virginia | 3.95 | 69,995 | 1,769,979 |
| 32 | Connecticut | 3.68 | 135,295 | 3,675,069 |
| 33 | North Dakota | 3.67 | 29,241 | 796,568 |
| 34 | Massachusetts | 3.65 | 260,781 | 7,136,171 |
| 35 | Virginia | 3.56 | 313,307 | 8,811,195 |
| 36 | Illinois | 3.50 | 445,020 | 12,710,158 |
| 37 | Texas | 3.45 | 1,079,033 | 31,290,831 |
| 38 | Georgia | 3.31 | 370,065 | 11,180,878 |
| 39 | Arizona | 3.06 | 232,360 | 7,582,384 |
| 40 | Mississippi | 3.04 | 89,459 | 2,943,045 |
| 41 | Florida | 2.60 | 608,037 | 23,372,215 |
| 42 | Maryland | 2.41 | 150,653 | 6,263,220 |
| 43 | California | 2.24 | 882,863 | 39,431,263 |
| 44 | New Mexico | 2.23 | 47,573 | 2,130,256 |
| 45 | Rhode Island | 2.10 | 23,314 | 1,112,308 |
| 46 | Nevada | 1.94 | 63,226 | 3,267,467 |
| 47 | Hawaii | 1.90 | 27,405 | 1,446,146 |
| 48 | Louisiana | 1.66 | 76,141 | 4,597,740 |
| 49 | New Jersey | 1.60 | 151,700 | 9,500,851 |
| 50 | New York | 1.56 | 309,692 | 19,867,248 |
| 51 | Washington D.C. | 0.39 | 2,749 | 702,250 |
Which U.S. States Play the Most Disc Golf Generally?
| Rank | State | Disc Golf Rounds 2024 with UDisc | Population |
| 1 | Texas | 1,079,033 | 31,290,831 |
| 2 | California | 882,863 | 39,431,263 |
| 3 | Michigan | 753,150 | 10,140,459 |
| 4 | North Carolina | 665,896 | 11,046,024 |
| 5 | Ohio | 617,917 | 11,883,304 |
| 6 | Florida | 608,037 | 23,372,215 |
| 7 | Pennsylvania | 534,450 | 13,078,751 |
| 8 | Minnesota | 492,208 | 5,793,151 |
| 9 | Colorado | 480,045 | 5,957,493 |
| 10 | Illinois | 445,020 | 12,710,158 |
| 11 | Wisconsin | 413,355 | 5,960,975 |
| 12 | Missouri | 393,534 | 6,245,466 |
| 13 | Washington | 391,914 | 7,958,180 |
| 14 | Georgia | 370,065 | 11,180,878 |
| 15 | Indiana | 352,225 | 6,924,275 |
| 16 | Oregon | 331,949 | 4,272,371 |
| 17 | Virginia | 313,307 | 8,811,195 |
| 18 | New York | 309,692 | 5,478,831 |
| 19 | Tennessee | 306,954 | 7,227,750 |
| 20 | South Carolina | 275,587 | 5,478,831 |
| 21 | Kansas | 264,552 | 2,970,606 |
| 22 | Massachusetts | 260,781 | 7,136,171 |
| 23 | Utah | 244,596 | 3,503,613 |
| 24 | Arizona | 232,360 | 7,582,384 |
| 25 | Oklahoma | 227,300 | 4,095,393 |
| 26 | Iowa | 215,101 | 3,241,488 |
| 27 | Alabama | 211,656 | 5,157,699 |
| 28 | Kentucky | 190,443 | 4,588,372 |
| 29 | Maine | 180,307 | 1,405,012 |
| 30 | New Jersey | 151,700 | 9,500,851 |
| 31 | Maryland | 150,653 | 6,263,220 |
| 32 | Arkansas | 143,049 | 3,088,354 |
| 33 | Connecticut | 135,295 | 3,675,069 |
| 34 | Idaho | 133,633 | 2,001,619 |
| 35 | New Hampshire | 132,279 | 1,409,032 |
| 36 | Nebraska | 100,390 | 2,005,465 |
| 37 | Mississippi | 89,459 | 2,943,045 |
| 38 | Louisiana | 76,141 | 4,597,740 |
| 39 | Vermont | 74,391 | 648,493 |
| 40 | West Virginia | 69,995 | 1,769,979 |
| 41 | Nevada | 63,226 | 3,267,467 |
| 42 | Montana | 56,531 | 1,137,233 |
| 43 | Delaware | 49,042 | 1,051,917 |
| 44 | New Mexico | 47,573 | 2,130,256 |
| 45 | South Dakota | 46,190 | 924,669 |
| 46 | Alaska | 33,459 | 740,133 |
| 47 | North Dakota | 29,241 | 796,568 |
| 48 | Hawaii | 27,405 | 1,446,146 |
| 49 | Wyoming | 23,356 | 587,618 |
| 50 | Rhode Island | 23,314 | 1,112,308 |
| 51 | Washington D.C. | 2,749 | 702,250 |
Learn about the stats we have to offer and how to contact us about them in "Free Disc Golf Stats From UDisc For Your Pitch, Proposal, Or Presentation."
