
In most places, the hardest part about pitching disc golf to decision-makers is getting them to take the sport seriously. And, honestly, if we didn't know better, it'd probably sound a bit far-fetched that putting up strange metal contraptions for people to throw special Frisbees at could be a worthwhile investment.
But the team here at UDisc does know better thanks to the largest and most reliable set of disc golf stats available produced by disc golfers all over the world. The most popular app in the sport, UDisc helps players discover courses, keep score, organize and play events and leagues, and much more.
Every day, all that activity paints a picture showing the considerable impact disc golf has across the globe – how it gets people moving, connects them with others in their communities, and turns neglected spaces into hubs of healthy recreation. When local leaders see parts of that picture, it helps them understand the variety of benefits disc golf can offer your community.
Since our mission here at UDisc is to empower the world to play more disc golf, we're happy to provide relevant stats for free to anyone working on a project to expand the sport. Here you can find out what stats we have to offer, how they've helped other disc golf projects succeed, and tips for presenting them effectively.
Important: Read This Before Checking Out Our Disc Golf Stat Offerings
Our statistics come from people recording rounds with UDisc at courses in our directory, the most complete and frequently updated disc golf course directory in existence. There are currently over 16,000 disc golf courses listed there with course maps, quality and difficulty ratings, and much more.
Though we are the most popular disc golf app, far from every round of disc golf played at any course is recorded with UDisc. While the exact ratio of rounds that are recorded with UDisc varies from place to place, one thing is absolutely certain: The real numbers are always bigger than UDisc numbers.
Use UDisc stats to impress local decision makers, and then raise their eyebrows even more by emphasizing that the stats are just a fraction of the real impact disc golf is having.
Post Navigation
We can offer the following stats for any course(s) in the UDisc directory based on rounds recorded there with the UDisc app. To jump to a topic that interests you, just click or tap it:
- Disc golf play/round counts
- Hours spent on disc golf courses
- Steps taken during disc golf rounds
- Disc golf tourism: How far are people travelling to play a course and where are they coming from?
- Unique players: How many different people is a course attracting?
And go here to find out how to get the disc golf stats you're looking for.
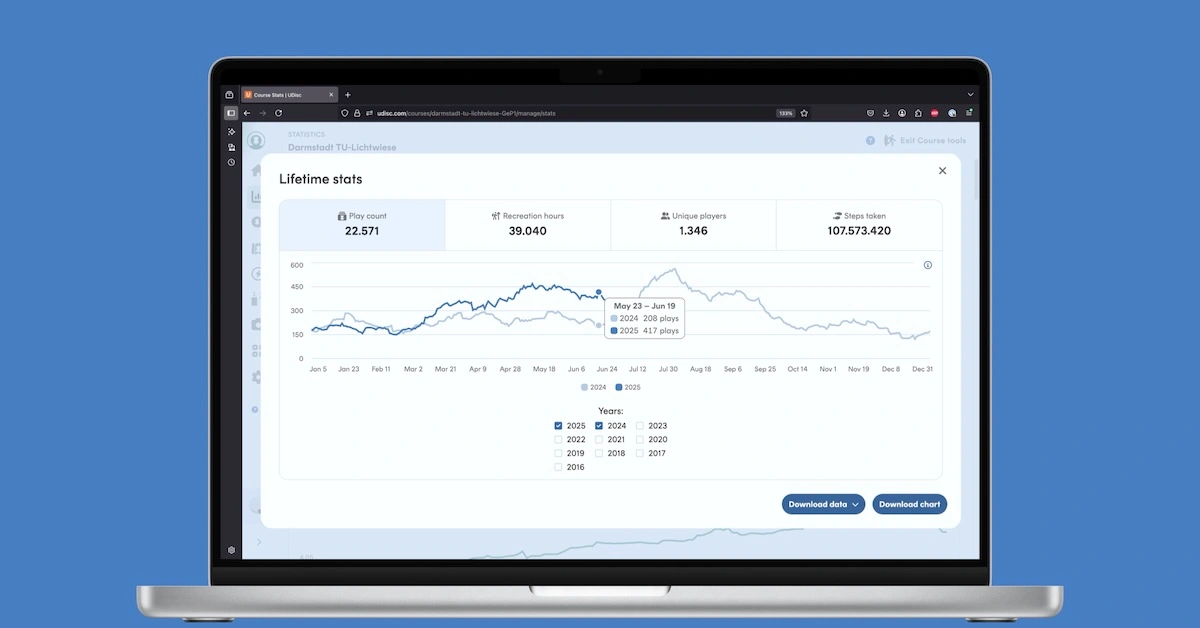
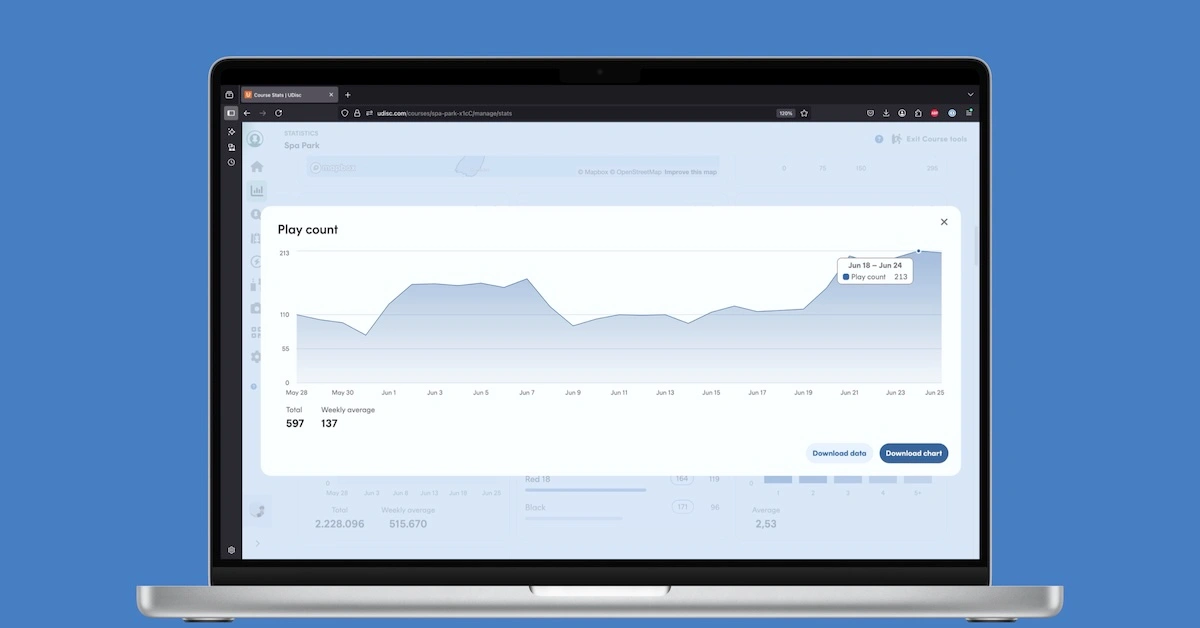
UDisc Disc Golf Play Counts for Courses
Sometimes the simplest way to show disc golf's impact or potential in an area is with play or round counts, i.e., the number of disc golf rounds people have played at courses. We have daily play counts for all courses in the UDisc directory going back to 2016, and it's easy to convert those into longer-term totals (monthly, yearly, etc.).
Try to keep your audience in mind, though. While disc golfers know that a single "play" of a course means a minimum of about 45 minutes of recreation time than can extend up to three hours or more for groups taking on big courses, community and park officials who've never heard of the sport won't have that context.
When presenting to a crowd with little or no knowledge of disc golf, emphasizing stats like recreation hours and step counts using relatable comparisons to familiar activities is likely to help your cause more than presenting play counts off the bat. That's especially true if they have goals related to increasing community fitness or engagement.
All that said, it's fairly obvious how play counts can help you if you're trying to upgrade or expand an existing course – high traffic shows high interest in disc golf infrastructure, and falling traffic could show the need for some improvements.
With the right context, play counts can help bring a new course to your area, too. Our own blog contributor Alex Williamson experienced that when he embarked on a successful campaign to build the first disc golf course in his region.
"In my presentation to local government officials, I included UDisc play counts from the nearest courses about an hour's drive away," he said. "The simple fact that those places were seeing thousands of rounds per year impressed them a lot, but they were also very interested to see how the plays ticked up year-to-year as interest steadily grew."
Even when there aren't courses anywhere in your area, round counts could help your cause. Maybe there's a distant course in a place similar to your own in terms of population, landscape, or other factors that can show the sport's potential.
Along with the methods for getting stats we talk about in this post's last section, you can find annual play counts for any course from 2019-2024 by hovering over it in the interactive map at the end of our latest Disc Golf Growth Report.
Recreation Hours Spent on Disc Golf Courses
Knowing how much time people spend on disc golf courses – A.K.A., recreation hours – makes it easier to show the payoff decision-makers can expect if they decide to support disc golf. And that payoff is often truly impressive.
For instance, in our 2025 Disc Golf Growth Report, we highlighted a study from three evironmental economists showing that just two courses in New York state annually provide millions of dollars worth of recreational benefit (i.e., the amount of extra value someone receives from an activity on top of how much they paid for it) to visitors. One of their key conclusions was that how much time people spend on disc golf is a great way to show how valuable it is – and that's exactly what recreation hour stats accomplish.
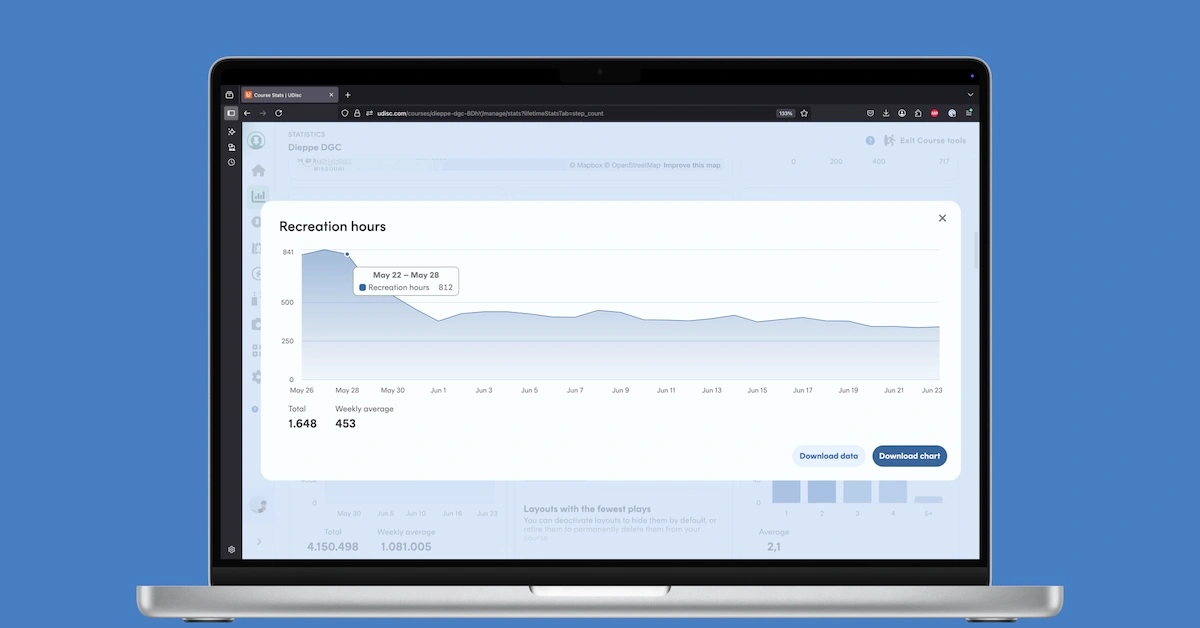
When you talk about recreation hours, they're often so big that it's hard for people to truly grasp what they mean. Here are some tricks that can make them easier to understand:
- Divide the number of recreation hours in a certain time period by 24 to make the number into full days. If a course is averaging, say, 450 recreation hours per week, it's likely easier to understand that when you translate it to "about 19 full days."
- Compare disc golf recreation hours favorably to another activity that's more relatable to the people you're presenting to. For example, "you could play X number of soccer games," "bake X number of pound cakes," or "watch X number of episodes of [insert TV show]" in the number of hours played per week, month, or year at a course.
Steps Taken During Disc Golf Rounds
As we covered in detail in the post "How Far You Walk During Disc Golf Rounds & Why It's So Healthy," one of the best selling points of disc golf is that, for many, it makes the physically and mentally beneficial activity of taking walks outdoors a lot more attractive without requiring higher levels of fitness.
After all, what decision-maker wants to say no to promoting a fitter, happier community?
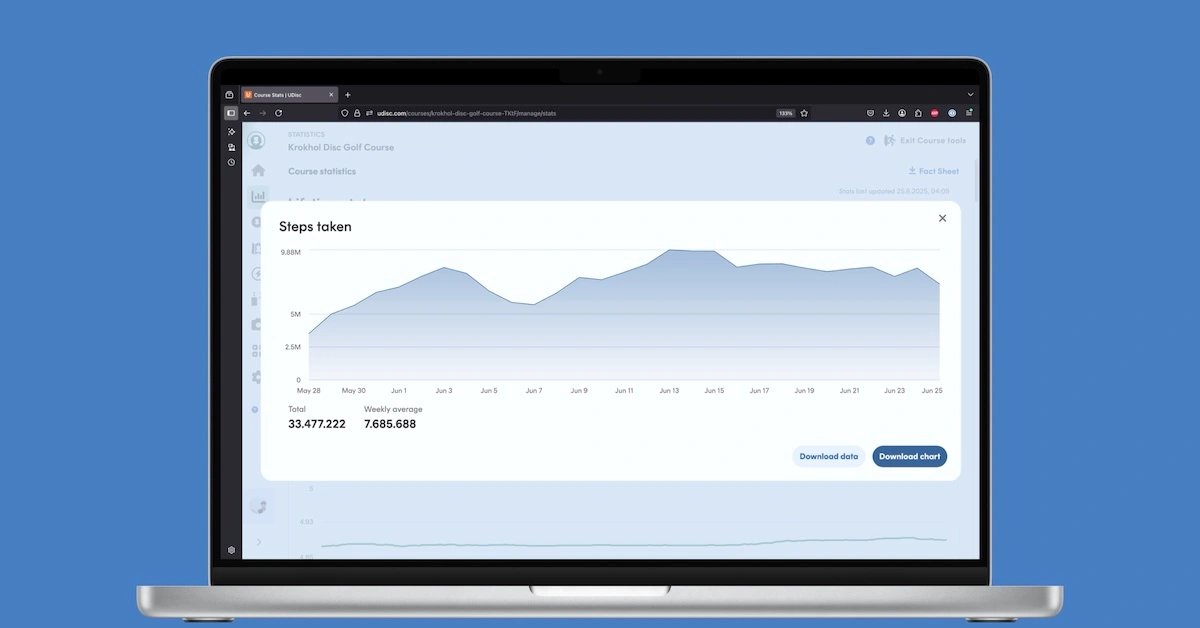
Step counts from UDisc help demonstrate exactly how much physical benefit people get from disc golf courses. Like with recreation hours, step count totals are most effective when they're put into a relatable context. Here's how we usually do it:
- Take the step count from a course and put it into a step count to distance calculator to convert the steps into miles or kilometers. You can use the calculator's default for height and other details or use a search engine to find out averages in your country, region, etc.
- Convert that distance into something that helps show how momentous it is. For example, you could compare it to "walking across [state, province, country] X times" or “making the trip from [local landmark] to [local landmark] X times." Use an online mapping tool (e.g., Google Maps) to help you find exact distances.
UDisc Stats Showing Disc Golf Tourism
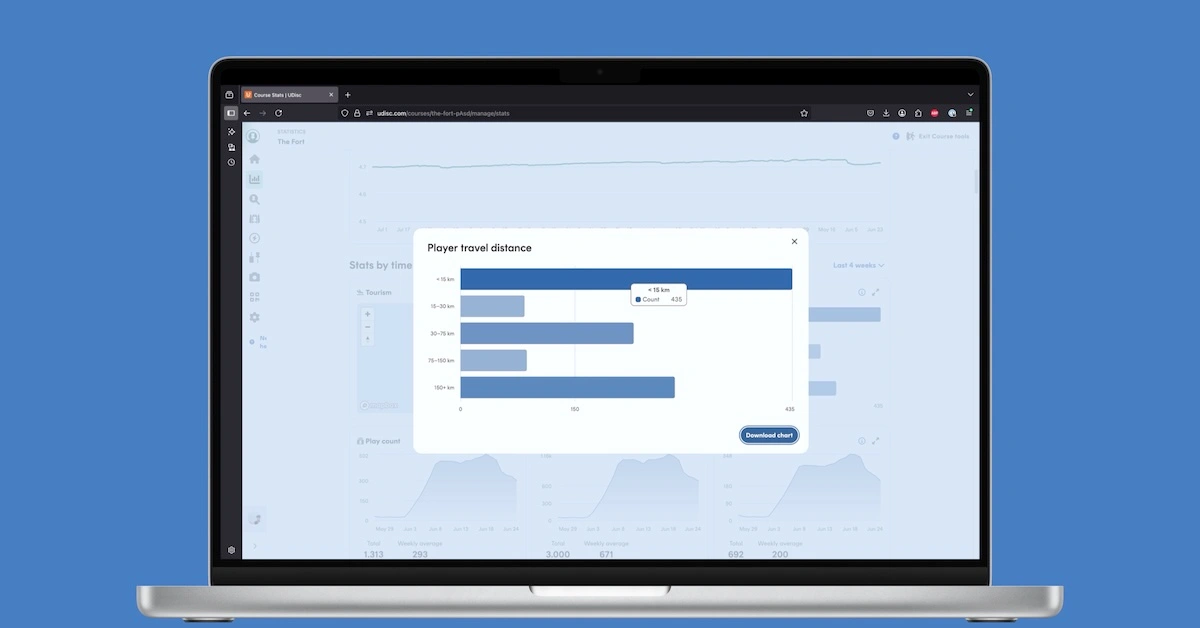
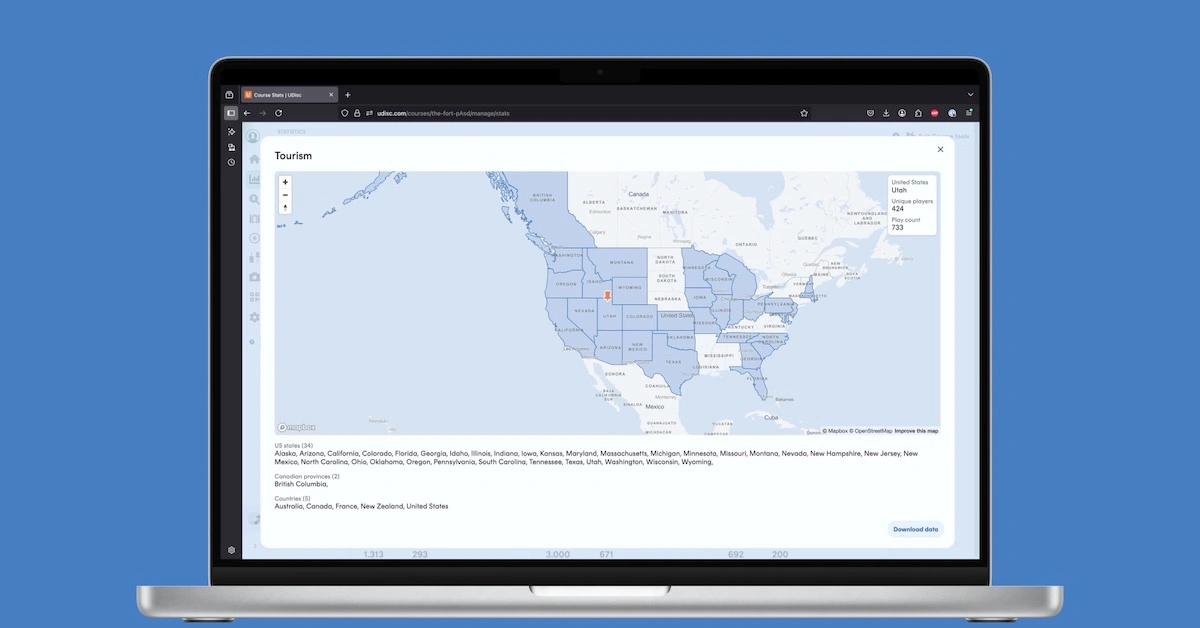
UDisc has stats showing how far players travel to play a course as well as where they're coming from (U.S. states, Canadian provinces, countries). If you're hoping to build or upgrade a destination course or make the case for disc golf as a tourism draw and boost for the local economy, these numbers can be extremely helpful.
Scott Belchak spoke to these points when we talked to him for our post "When Disc Golf Courses Get Needed Upgrades, Everyone Benefits." Belchak secured funds to upgrade Creekside Park Disc Golf Course just outside of Salt Lake City, Utah, with some help from UDisc data. His work made one of the busiest courses in the world even busier and better able to handle its extremely high traffic load.
"You can visualize disc golf courses as a heat map – if you build the nicest course you possibly can, a new light will emerge on the map," Belchak told us. "People are going to change their playing habits and patterns. Local restaurants, gas stations, and grocery stores will all benefit. These things are very important to stakeholders."
Unique Player Counts for Disc Golf Courses
Some stakeholders may be curious to know how many different people disc golf courses tend to draw. UDisc's unique player stats can help you answer their questions.
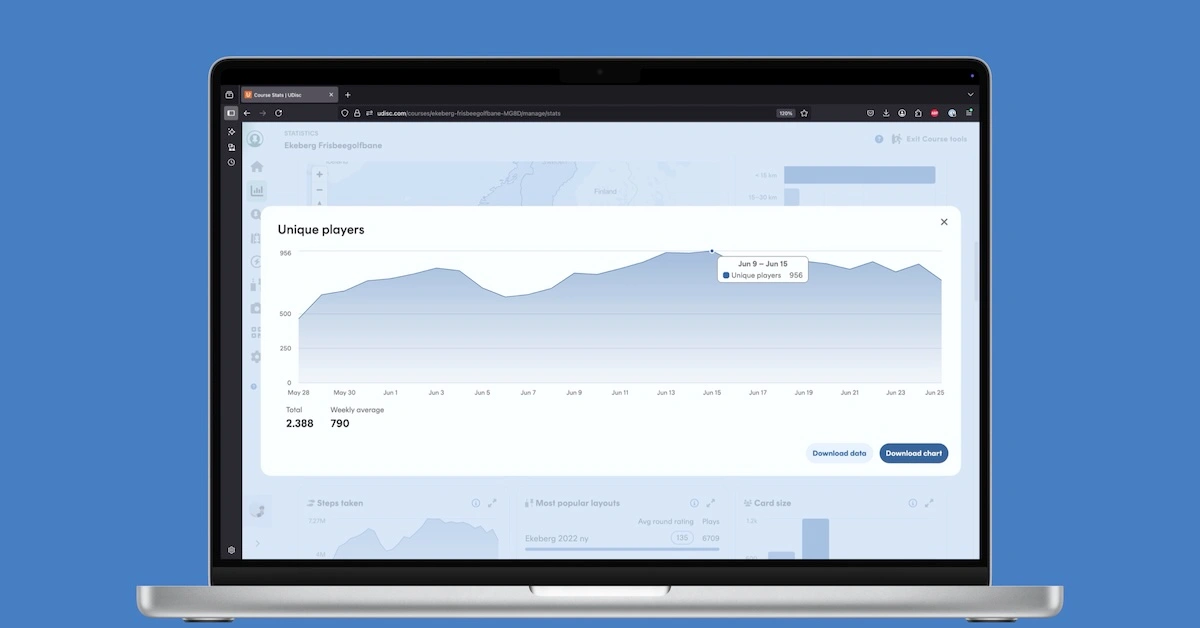
In many cases you can divide round counts by unique player counts within the same time period to demonstrate how a course generates repeat visits and isn't something community members enjoy once and then forget about.
How to Get Disc Golf Stats from UDisc to Support Your Project
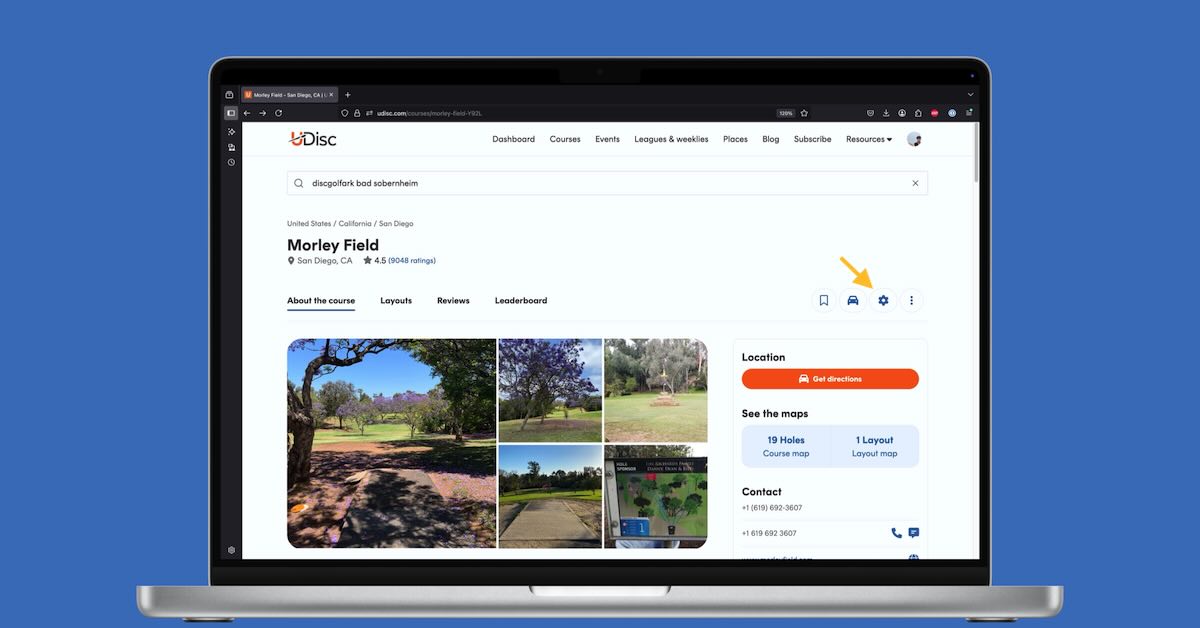
When you are a UDisc Course Ambassador, you have access to all the stats discussed above at courses you're an Ambassador for. Just go to Statistics from one of your course's Dashboards. The Dashboard is the same place you update and manage layouts, and it's accessible by clicking or tapping the cog in the upper right below your course's name on its UDisc Courses page.
If you only need stats for local courses but are not an Ambassador for those courses, reach out to disc golf community leaders to see if you can discover who the Course Ambassadors are and if they can get you the stats you're looking for.
Hoping for disc golf stats for courses outside of your community or having trouble contacting a Course Ambassador? Reach out to our team at [email protected]. Give us a brief overview of the project you're working on and which stats will support your efforts, and we'll do our best to get you what you need as soon as we can.
Thanks for helping empower the world to play more disc golf!
